Background
Out system became unavailable due to java.lang.OutOfMemoryError: Metaspace and according to a stackoverflow answer: https://stackoverflow.com/questions/36051813/java8-java-lang-outofmemoryerror-metaspace, I started to figure out what wrong with the system.
Before finding start analysis jvm memory dump, we need to known what means memory leak. In this case, we found thread failed to execution because create task failed due to OOM. But there are two typical reason.
- Too many classes need to be loaded
- Memory leak causes some classes not unloaded
Everytime you new a object, metaspace will be allocated to store metadata of the object.
Following code could reproduce this issue:
1 | import javassist.ClassPool; |
pom.xml
1 | <dependency> |
so dynamic created class will add new class information into metaspace but if there is no class loader reference to the class, the class will be cleared after GC.
So it’s clear that if memory leak happened to your metaspace, you can find your application no problem when just started and oom happens after it runs for a period of time.
Tools
A couple of tools are available for memory leak analysis and only refer to what I have used when I figure out this issue.
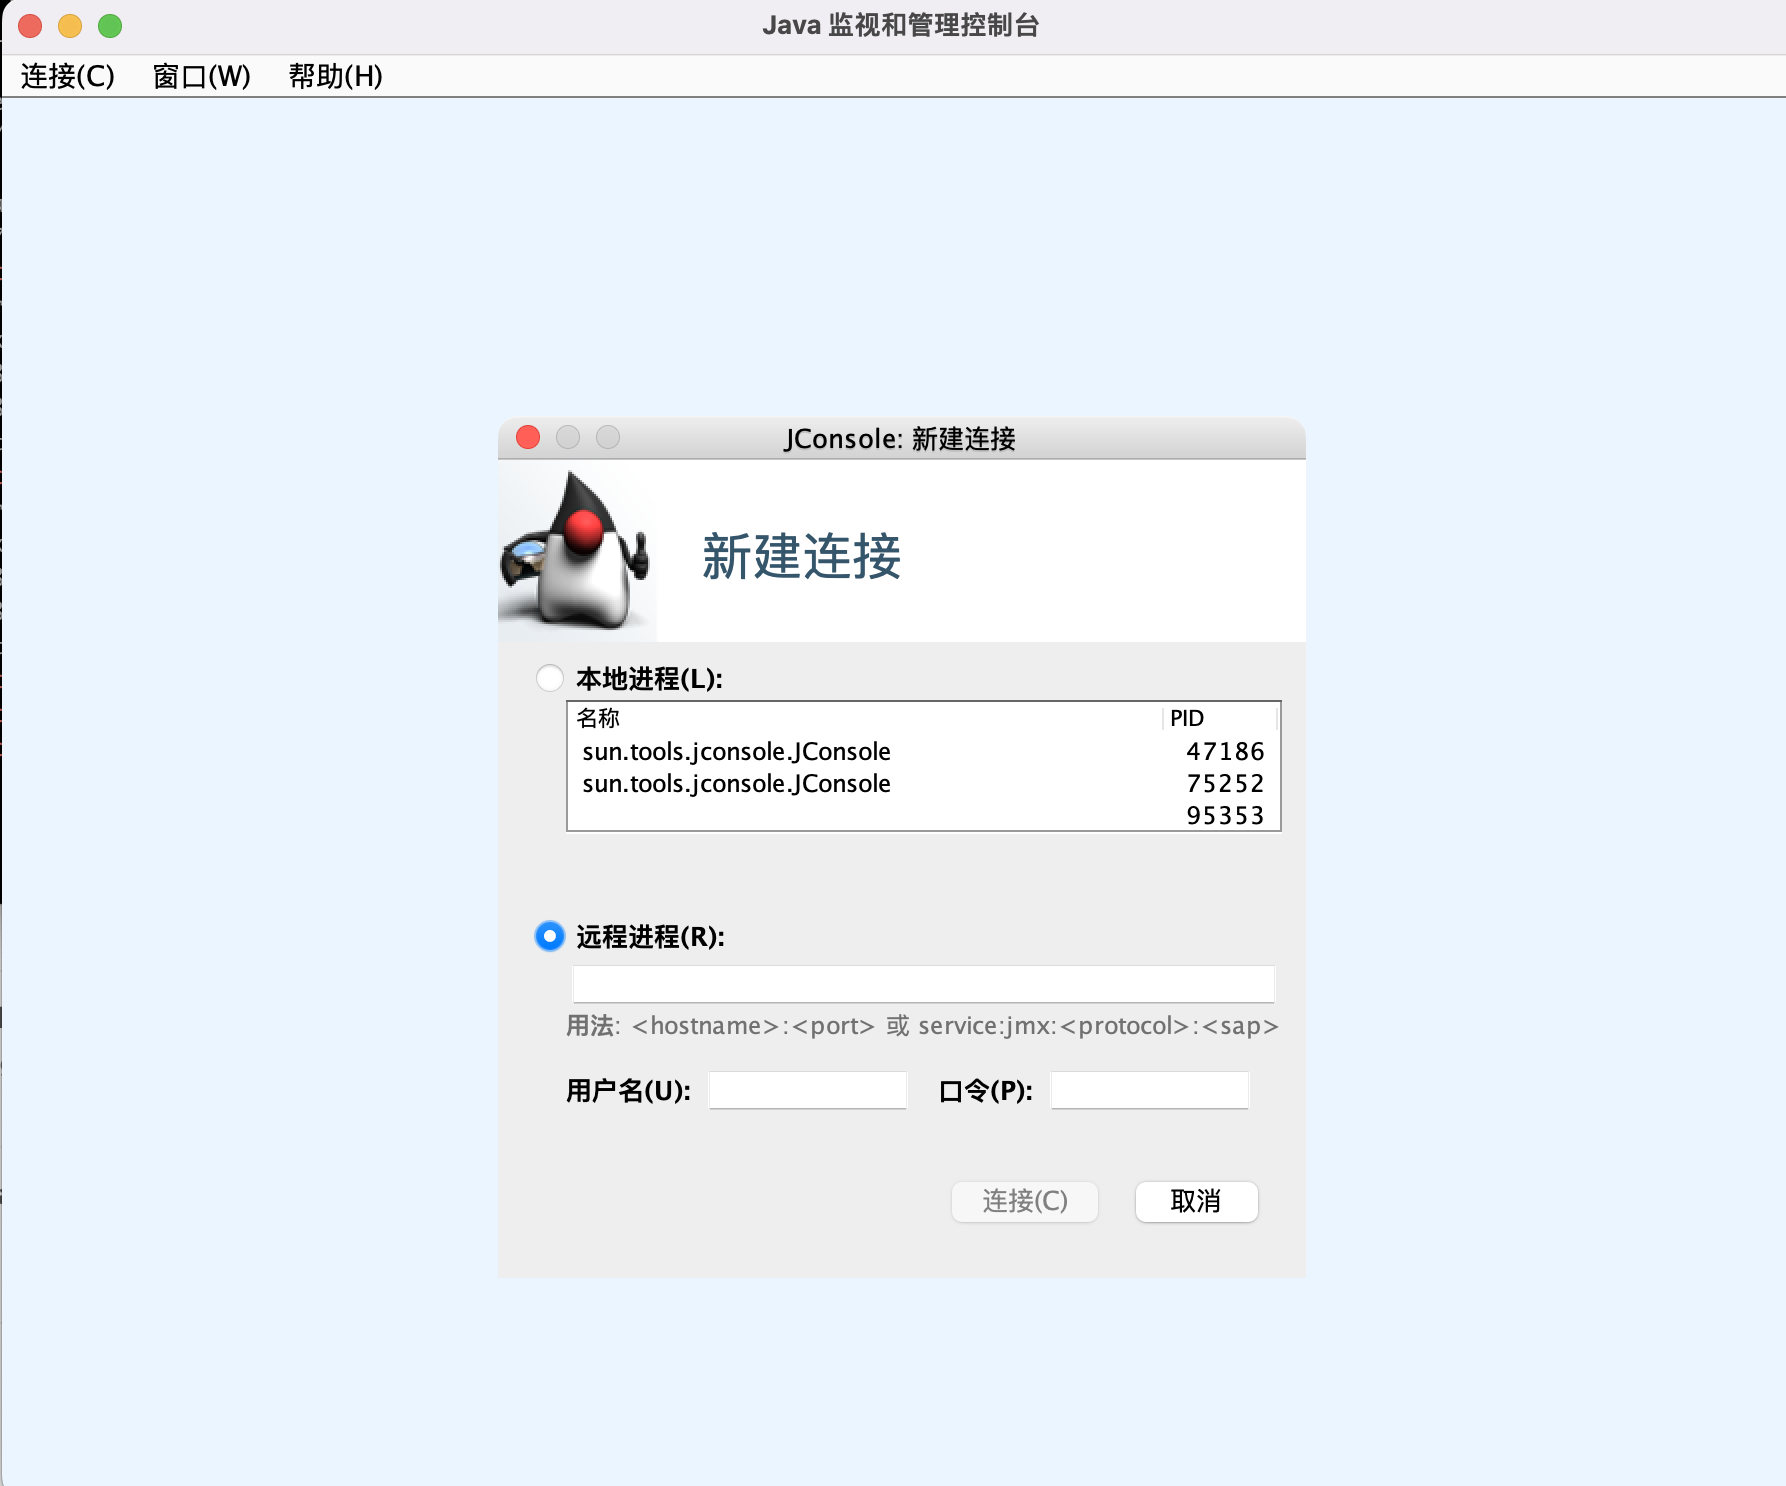
JConsole
JConsole is a graphical monitoring tool to monitor Java Virtual Machine (JVM) and Java applications both on a local or remote machine.
JConsole uses underlying features of Java Virtual Machine to provide information on performance and resource consumption of applications running on the Java platform using Java Management Extensions (JMX) technology. JConsole comes as part of Java Development Kit (JDK) and the graphical console can be started using “jconsole” command.
As JConsole is a part of JDK, you can easily find it. On macOS, you can use commandline directly
1 | jconsole |
or find your java_home by
1 | /usr/libexec/java_home -V |
the jconsole is under
1 | /Library/Java/JavaVirtualMachines/jdk1.8.0_271.jdk/Contents/Home/bin/jconsole |
and then connect to local or remote application.
Note:
In order to use JConsole, jmx need to be enabled for your application’s jvm options
1 | -Dcom.sun.management.jmxremote -Dcom.sun.management.jmxremote.port=10000 -Dcom.sun.management.jmxremote.ssl=false -Dcom.sun.management.jmxremote.authenticate=false -Dcom.sun.management.jmxremote.local.only=false -Djava.rmi.server.hostname=your_ip_address |
make sure your ip adress and port is available for remote access.
From JConsole we can monitor loaded class number, unloaded class number, perform gc and check if metaspace is continuously increasing.
VisualVM
A replacement for JConsole except jvm monitor, heap dump, application snapshot is available which is quite efficient for memory leak analysis.
Memory Analyzer (MAT)
The Eclipse Memory Analyzer is a fast and feature-rich Java heap analyzer that helps you find memory leaks and reduce memory consumption.Use the Memory Analyzer to analyze productive heap dumps with hundreds of millions of objects, quickly calculate the retained sizes of objects, see who is preventing the Garbage Collector from collecting objects, run a report to automatically extract leak suspects.
My application use openjdk-1.8, so only MemoryAnalyzer-1.11.0.20201202-macosx.cocoa.x86_64.dmg
could be used. After that MAT only support java11.
Start debug
Combining background and tools, finding continuously increasing memory is easy but how to get to the code seems more diffcult.
But we could seperate debug procedure to several steps
- Do heap dump during a period to known always in memory classes and dynamic classes
- Compare heap dump to figure out what increase metaspace
- Find a operation that causes the leak
Use visualVM connect to java application and monitor for a time
Metaspace leak can be monitored because after manually perforce GC, it still not decrease.
GC performed we have 72246 loaded classes.
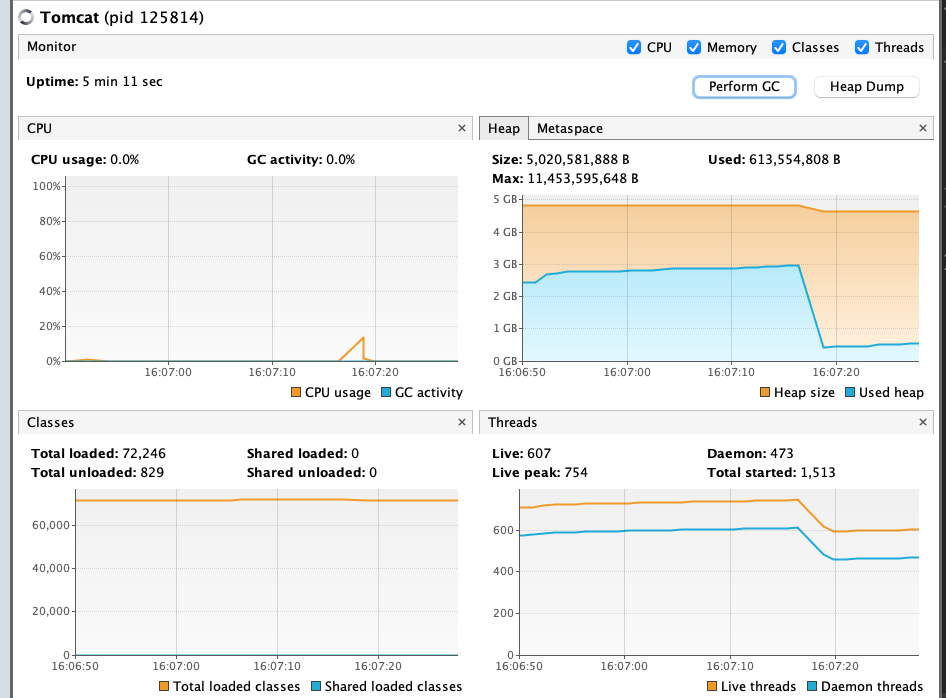
after aboubt 1minutes, GC performed but loaded class increased to 72262

Aboviously there are some leak problems, so still use 1 minute as period and collect two heap dump for next step analysis.
Open the heap dumps with MAT to do compare, from heap dump’s dominator tree
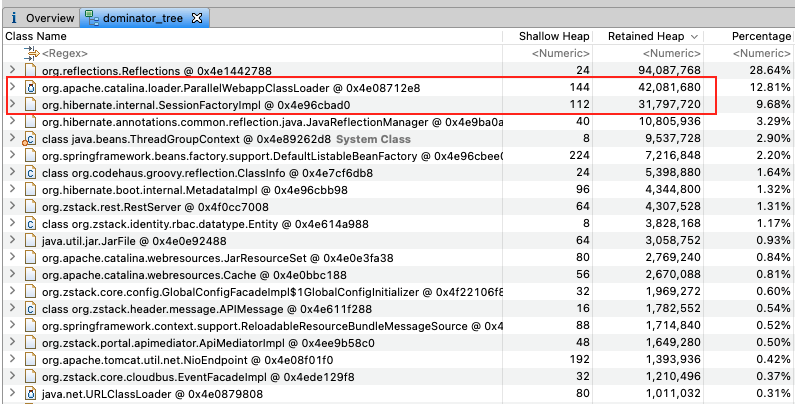
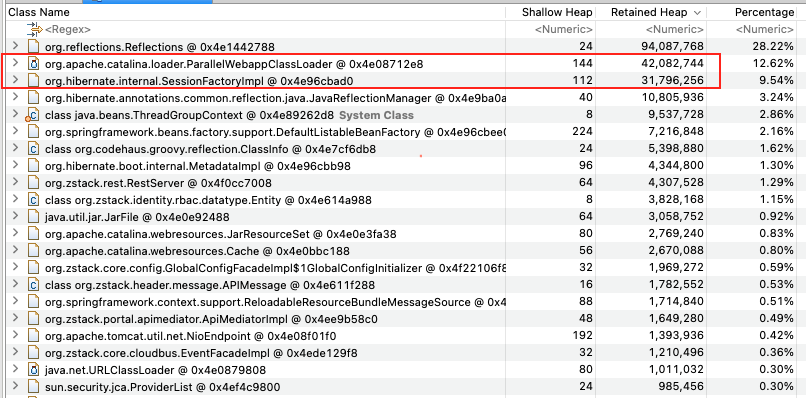
Luckily, we found the increased class at first glance. The SessionFactoryImpl seems to blame.
Except this we found another issue with Groovy’s GStringTemplateEngine which causes groovy.reflection.ClassInfo increases and we will tell the details in next section.
Expand the suspects to get more details about it. By list all objects, query plan cache increased, so just google for this value
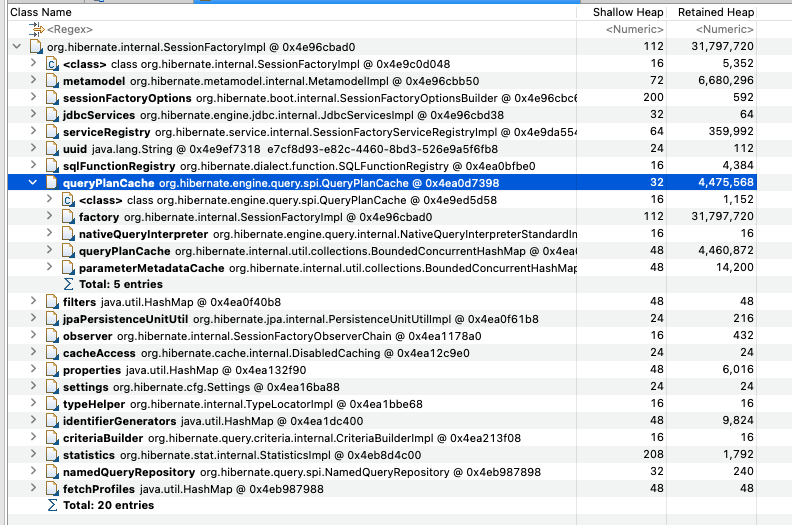
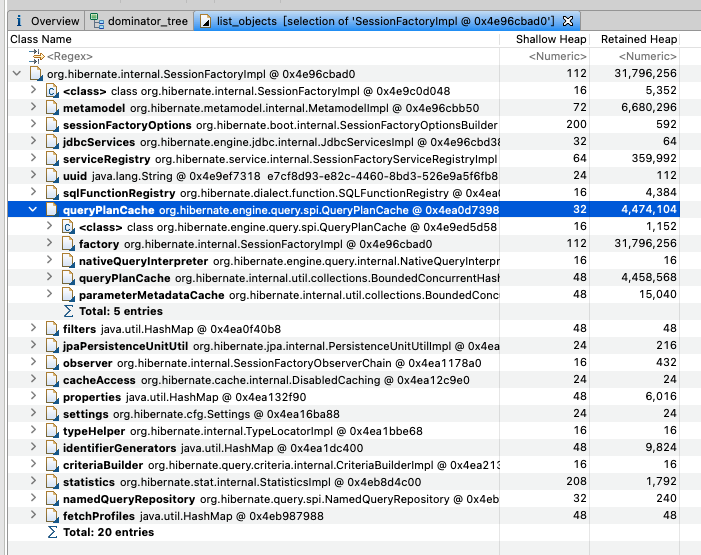
from https://docs.jboss.org/hibernate/orm/5.0/javadocs/org/hibernate/engine/query/spi/QueryPlanCache.html: Acts as a cache for compiled query plans, as well as query-parameter metadata.
And check its source code:
1 | /** |
it seems a bounded hashmap and created like below:
1 | queryPlanCache = new BoundedConcurrentHashMap( maxQueryPlanCount, 20, BoundedConcurrentHashMap.Eviction.LIRS ); |
and hibernate use default 2048 as maxQueryPlanCount and LIRS as eviction strategy. So no need to solve a cache increasing.
GStringTemplateEngine
By debug steps, we find GStringTemplateScript occupied metaspace and thousands of classes are created.
Check its implements,
1 | groovyClass = loader.parseClass(new GroovyCodeSource(templateExpressions.toString(), "GStringTemplateScript" + GStringTemplateEngine.counter.incrementAndGet() + ".groovy", "x")); |
GStringTemplateScript will be created every GStringTemplate created. So for template creation, will cause dynamic class creation and finally let jvm run out of memory.
According to some related fix, https://issues.apache.org/jira/browse/GROOVY-7017 this fix use a seperate class loader to make sure gstring template could be gced from heap but metaspace is still occupied.
And another article talk about: https://tigase.net/how-aws-helped-us-optimize-memory-usage-tigase-http-api/ AWS improve Tigase HTTP API Memory usage, following fix is suggested:
- We load all templates at once using single
GStringTemplateEngineand cache generate templates. No more automatic reloading of templates. - When manual reload of templates is initiated we release old instance of
GStringTemplateEngineand parse templates using the new one.
So do some test before change our code:
1 | import groovy.text.GStringTemplateEngine; |
by use templateHashMap as cache to avoid duplicate template creation, we can see Metaspace memory usage not changed
but if change the code without templateHashMap:
1 | import groovy.text.GStringTemplateEngine; |
the metaspace will increase until oom.